Tag Archives: Global Market Forecast

Airbus vs. Boeing, comparison of market forecasts (2017)

Two weeks ago, during Le Bourget air show in Paris, both Airbus and Boeing released their market forecasts for the following 20 years: Airbus’ Global Market Forecast (GMF, PDF 3.6 MB) and Boeing’s Current Market Outlook [PDF, 3.8 MB].

In previous years, I have published comparisons (1) of both Airbus’ and Boeing’s forecasts. You can find below the update of such comparison with the latest released figures from both companies.
Forecast2017

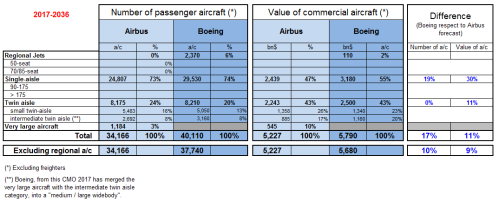
Comparison of Airbus GMF and Boeing CMO 2017-2036.

Some comments about the comparison:

  • The main comment for this year CMO is that after years of Boeing dowplaying the demand for the segment of the large aircraft (seen as mainly 747, A380 and some other high capacity aircraft, depending on the manufacturer), it has finally stopped to consider them a category by themselves and has merged that category with the “intermediate twin-aisle” (i.e. 777, A350…).
  • Excluding the large aircraft, both companies’ forecast for the twin aisle segment is nearly identical: ~8,175-8,210 aircraft (we may assume that about 100 of those 8,210 from Boeing’s CMO correspond to large aircraft, thus comparing apple to apples would be ~8,175-8,100). The mix between small and intermediate twins varies, ~400 units up and down.
  • On the other hand, Boeing forecasts about 4,700 single-aisle more than Airbus (the gap has widened in 100 units this year). Boeing doesn’t provide the split between more or less than 175 pax capacity airplanes since its 2015 CMO, nor does Airbus since 2016.
  • Alltogether, Boeing sees demand for 10% more passenger aircraft (excluding regional a/c and freighters) with a 9% more value. The gap is slightly lower than in 2016.
  • In relation to last year’s studies, Airbus has increased demand by ~1,700 aircraft (and ~ 190 Bn$) whereas Boeing has increased it by 1,400 (and ~ 130 Bn$).
  • In relation to traffic, measured in terms of RPKs (“revenue passenger kilometer”), that is, the number of paying passenger by the distance they are transported, they see a similar future: Airbus forecasts for 2036 16.5 RPKs (in trillion, 4.4% annual growth from today) while Boeing forecasts 17.8 RPKs (4.7% annual growth).

Some lines to retain from this type of forecasts:

  • Passenger world traffic (RPK) will continue to grow about 4.5% per year. This is, doubling every ~15 years.
  • Today there are about 18,890 passenger aircraft around the world (according to Airbus; 19,130 in Boeing’s CMO), this number is about 800 a/c more than the year before (5% increase) and will more than double over the next 20 years to 40,120 a/c in 2036 (41,320 as seen by Boeing, excluding regional jets).
  • Most deliveries will go to Asia-Pacific, 42% or ~17,000 passenger aircraft (according to Airbus).
  • Domestic travel in China will be the largest traffic flow in 2036 with over 2,000 bn RPK (according to Boeing, an annual growth of 6.1%), or 11.6% of the World’s traffic.
  • Nearly 13,000 aircraft will be retired to be replaced by more eco-efficient types.
Middle_Class

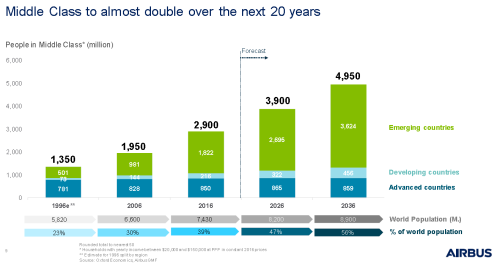
The doubling of the world’s middle class over the next 20 years will fuel air traffic growth and new airplanes demand.

As I do every year, I strongly recommend both documents (GMF and CMO) which provide a wealth of information of market dynamics.


(1) Find here the posts with similar comparisons I made with the forecasts of previous years: 201020112012, 2013, 2014, 20152016.

2 Comments

Filed under Aerospace & Defence

Airbus vs. Boeing, comparison of market forecasts (2016)

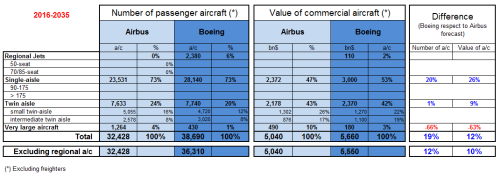
Last week, on the first day of Farnborough air show, Airbus released the new figures of the 2016-35 Airbus’ Global Market Forecast (GMF, PDF 2.6 MB). This is good news, as it did so at the same time as Boeing released its Current Market Outlook (see a post here about it) and before it used to do so in September.

In previous years, I have published comparisons (1) of both Airbus’ and Boeing’s forecasts (Current Market Outlook, CMO, PDF 4.1 MB). You can find below the update of such comparison with the latest released figures from both companies.

Comparison of Airbus GMF and Boeing CMO 2016-2035.

Comparison of Airbus GMF and Boeing CMO 2016-2035.

Some comments about the comparison:

  • Boeing sees demand for 12% more passenger aircraft (excluding regional a/c) with a 10% more value (excluding freighters). The gap is higher than in 2015 (similar to 2013 and previous years).
  • In relation to last year studies, Airbus has increased demand by ~650 aircraft whereas Boeing has increased by 1,670.
  • Boeing continues to play down A380 niche potential (66% less a/c than Airbus’ GMF).
  • Both companies’ forecast for the twin aisle segment is nearly identical: ~7,600-7,700 aircraft (Airbus sees demand for about a 100 less aircraft than Boeing, mainly due to Boeing increased figures in relation to 2015). The mix between small and intermediate twins varies, ~300-400 units up and down. However, Boeing’s wide-bodies mix is not to be taken as engraved in stone, see the erratic trend in the last years here.
  • On the other hand, Boeing forecasts about 4,600 single-aisle more than Airbus (the gap has widened in 800 units this year). Boeing doesn’t provide the split between more or less than 175 pax capacity airplanes since its 2015 CMO, this year Airbus hasn’t included it either.
  • In relation to traffic, measured in terms of RPKs (“revenue passenger kilometer”), that is, the number of paying passenger by the distance they are transported, they see a similar future: Airbus forecasts for 2035 ~16.0 RPKs (in trillion, 4.5% annual growth from today) while Boeing forecasts 17.01 RPKs (4.8% annual growth).

The main changes from last year’s forecasts are:

  • Both manufacturers have increased their passenger aircraft forecast in between ~650-1,670 a/c.
  • Both manufacturers have increased the volume (trn$) of the market in these 20 years, by about 300-400 bn$.

Some lines to retain from this type of forecasts:

  • Passenger world traffic (RPK) will continue to grow about 4.5% per year (4.8% according to Boeing). This is, doubling every ~15 years.
  • Today there are about 18,019 passenger aircraft around the world (according to Airbus; 18,190 in Boeing’s CMO), this number is about 700 a/c more than the year before (4% increase) and will more than double over the next 20 years to 37,708 a/c in 2035 (39,750 as seen by Boeing, excluding regional jets).
  • Most deliveries will go to Asia-Pacific, 41% or 13,239 passenger aircraft (according to Airbus).
  • Domestic travel in China will be the largest traffic flow in 2035 with over 1,600 bn RPK (according to Airbus (x 3.7 times more than today’s traffic), or 1,897 bn RPK according to Boeing), or 11% of the World’s traffic.
  • About 12,830 aircraft will be retired to be replaced by more eco-efficient types.
Passenger traffic growth vs. global GPD growth.

Passenger traffic growth vs. global GPD growth.

As I do every year, I strongly recommend both documents (GMF and CMO) which provide a wealth of information of market dynamics. This year, Airbus included as well an excel file with its data, find it here [XLS, 0.3 MB]

(1) Find here the posts with similar comparisons I made with the forecasts of previous years: 2015, 2014, 2013, 2012, 2011, 2010.

Leave a comment

Filed under Aerospace & Defence

Twin-aisle aircraft deliveries 20-year forecast (update 2015)

In a previous post I shared a graphic with the “Commercial wide-body airplanes’ deliveries per year, 1969-2015” (see below). I then commented:

“Looking backwards it’s clear that 2015 was a peak in wide-bodies deliveries. Looking forward it may have been a short-term peak, but looking further ahead it is not so clear.”

Commercial wide-body airplanes' deliveries per year, 1969-2015.

Commercial wide-body airplanes’ deliveries per year, 1969-2015.

Last November, I published a post, “Airbus vs. Boeing, comparison of market forecasts (2015)“, with the following table that compares Airbus’ Global Market Forecast and Boeing’s Current Market Outlook:

Comparison of Airbus GMF and Boeing CMO 2015-2034.

Comparison of Airbus GMF and Boeing CMO 2015-2034.

If we focus on the twin-aisle segment, we see that both companies are very closely forecasting between 7,500 and 7,600 passenger aircraft deliveries (with less than 90 aircraft of difference, a 1.2% deviation). The forecast for the freighters is not shown in the table but it is also very similar for the segment, between 718 (Airbus’ view) and 800 (Boeing’s) freighter aircraft. In combination, each company foresees between  8,290 (Boeing view) and 8,297 (Airbus’) airplanes’ deliveries in the segment. Remarkably similar and definitely converged from years ago.

In the very large aircraft segment both forecasts do not converge. But since the figures of deliveries are an order of magnitude lower, I will focus on what they define as “twin-aisle” segment.

Let’s put forward again the question: was 2015 a peak year in terms of twin-aisle deliveries?

Quick math: if we take those ~8,300 aircraft to be delivered in the next 20 years, we arrive at an average of 415 aircraft per year. That figure excludes the very large aircraft. In 2015, there were 367 deliveries of twin-aisles (excluding A380 and 747):

  • A330: 103
  • A350XWB: 14
  • 767: 16
  • 777: 98
  • 787: 135
  • IL-96: 1

Thus, in 2015 we would have been far from the peak. If we simply linearized those 8,300 deliveries from 2015 levels up to 2034, we would get the following profile:

Twin-aisle deliveries historic and 20-year forecast.

Twin-aisle deliveries historic and 20-year forecast.

The reader may correctly think that market forecast figures are not engraved in stone and are rather optimistic. Fair enough.

Both forecast have been rather accurate in the past forecasting traffic growth. Not necessarily in forecasting the number of aircraft in each specific segment. See the post, “Aircraft market forecasts accuracy (update 2014)“,  in which I analyzed Boeing CMO forecast of 1999 with the actual fleet at the end of 2013. See the result below:

Comparison of aircraft fleet at year-end 2013: 1999 forecast vs. actual (sources: Boeing CMO 1999 and 2014).

Comparison of aircraft fleet at year-end 2013: 1999 forecast vs. actual (sources: Boeing CMO 1999 and 2014).

Thus, in 2013 there were 27% less twin-aisle aircraft than what had been predicted in 1999.

If 2015 market forecasts were off the mark in the same proportion (27%), that would mean that instead of 8,300 airplane deliveries in the next 20 years we would see about 6,050… meaning ~300 airplanes per year in the 20-year span.

In that case, we might have seen the peak.

Let’s take a look at current backlogs at the end of 2015:

  • Airbus: 1,112 a/c
    • A330 family: 350 a/c
    • A350: 762 a/c
  • Boeing: 1,383 a/c
    • 767: 80 a/c
    • 777 family: 524 a/c
    • 787: 779 a/c

Thus, at the end of 2015 the combined backlog (firm) stood at ~2,500 airplanes. That is a 30% of the 8,300 forecast, and a 41% of the 6,050 aircraft (i.e. forecast reduced in 27%).

The sceptic reader could still have doubts of the quality of the backlog (i.e., some customers may go through troubled waters and cancel orders).

Last year, I published a post, “Boeing 787 orders, cancellations, deliveries & backlog through 2014“, in which I showed the orders and cancellations of the 787 programme since its launch. See the summary graphic below:

787 orders, cancellations, deliveries and backlog through 2014.

787 orders, cancellations, deliveries and backlog through 2014.

The 787 programme experienced serious delays and industrial issues from 2009 to 2013 in the midst of the worst financial and economic crisis since the Great Depression of the 1930s. Through 2014, the programme had suffered 247 cancellations out of 1,318 gross orders, that is almost 19% of cancellations.

I believe that 19% can be considered an upper ceiling of how much of the current 2015 twin-aisle backlog (~2,500 a/c) could be considered as dubious. Thus, at least about 2,000 firm orders could be seen as rather secured.

Let’s see at the question (was 2015 a peak year?) from a different perspective: in the immediate coming years, what are the announced production rates?

Thus, according to the announced production rates and targets, in 2016 we should see about 380 twin-aisle combined deliveries, higher than the 367 we saw in 2015.

Leave a comment

Filed under Aerospace & Defence

Airbus vs. Boeing, comparison of market forecasts (2015)

Few days ago, Airbus released the new figures of the 2015-34 Airbus’ Global Market Forecast (GMF, PDF 7.2MB).

In previous years, I have published comparisons of both Airbus’ and Boeing’s forecasts (Current Market Outlook, CMO, PDF 6.5MB). You can find below the update of such comparison with the latest released figures from both companies.

Comparison of Airbus GMF and Boeing CMO 2015-2034.

Comparison of Airbus GMF and Boeing CMO 2015-2034.

Some comments about the comparison:

  • Boeing sees demand for 9% more passenger aircraft (excluding regional a/c) with a 10% more value (excluding freighters). The gap is the same as in 2014 (in previous years Boeing forecasted up to 14% more aircraft).
  • In relation to last year studies, Airbus has increased demand by ~1,200 aircraft about the same increase seen at Boeing’s.
  • Boeing continues to play down A380 niche potential (67% less a/c than Airbus’ GMF). This year, Airbus has increased in about 50 units its forecasted demand for the VLA segment.
  • Both companies’ forecast for the twin aisle segment is nearly identical: ~7,500 aircraft (Airbus sees demand for about a 100 more than Boeing). The mix between small and intermediate twins varies, 700 units up and down. However, Boeing’s wide-bodies mix is not to be taken as engraved in stone, see the erratic trend in the last years here.
  • On the other hand, Boeing forecasts about 3,800 single-aisle more than Airbus (the gap has widened in 200 units this year, lower than in 2013 forecasts though). Boeing doesn’t provide in 2015 CMO the split between more or less than 175 pax capacity airplanes.
  • In terms of RPKs (“revenue passenger kilometer”), that is, the number of paying passenger by the distance they are transported, they see a similar future: Airbus forecasts for 2034 ~15.2 RPKs (in trillion, 4.6% annual growth from today) while Boeing forecasts 16.15 RPKs (4.9% annual growth).

The main changes from last year’s forecasts are:

  • Both manufacturers have increased their passenger aircraft forecast in ~1,200 a/c.
  • Both manufacturers have increased the volume (trn$) of the market in these 20 years, by about 300bn$ or 6.5%(excluding regional jets and freighters).

Some lines to retain from this type of forecasts:

  • Passenger world traffic (RPK) will continue to grow about 4.6% per year (4.9% according to Boeing). This is, doubling every ~15 years.
  • Today there are about 17,354 passenger aircraft around the world (according to Airbus; 17,350 in Boeing’s CMO), this number is about 500 a/c more than the year before (3% increase) and will more than double over the next 20 years to above 35,749 a/c in 2034 (over 37,990 as seen by Boeing, excluding regional jets).
  • Most deliveries will go to Asia-Pacific, 40% or 12,596 passenger aircraft (according to Airbus).
  • Domestic travel in China will be the largest traffic flow in 2034 with over 1,600bn RPK (according to Airbus (x 3.8 times more than today’s traffic), or 1,704bn RPK according to Boeing), or 11% of the World’s traffic.
  • About 13,400 aircraft will be retired to be replaced by more eco-efficient types.
GDP and traffic growth (source: Airbus 2015 GMF).

GDP and traffic growth (source: Airbus 2015 GMF).

As I do every year, I strongly recommend both documents (GMF and CMO) which provide a wealth of information of market dynamics.

4 Comments

Filed under Aerospace & Defence

Airbus vs. Boeing, comparison of market forecasts (2014)

Yesterday, Airbus released the new figures of the 2014-33 Airbus’ Global Market Forecast (GMF, PDF 7.5MB).

In previous years, I have published comparisons of both Airbus’ and Boeing’s forecasts (Current Market Outlook, CMO, PDF 5.3MB). You can find below the update of such comparison with the latest released figures from both companies.

Comparison of Airbus GMF and Boeing CMO 2014-2033.

Comparison of Airbus GMF and Boeing CMO 2014-2033.

Some comments about the comparison:

  • Boeing sees demand for 9% more passenger aircraft (excluding regional a/c) with a 10% more value (excluding freighters). The gap is closing, as in previous years Boeing forecasted up to 14% more aircraft.
  • In relation to last year studies, Airbus has increased demand by ~2,000 aircraft whereas Boeing by ~1,000.
  • Boeing continues to play down A380 niche potential (59% less a/c than Airbus’ GMF). This year, both companies have reduced in about 100 units their forecasted demand for the VLA segment.
  • Both companies’ forecast for the twin aisle segment is nearly identical: 7,260 aircraft. The mix between small and intermediate twins varies, 700 units up and down. However, Boeing’s wide-bodies mix is not to be taken as engraved in stone, see the erratic trend in the last years here.
  • On the other hand, Boeing forecasts about 3,600 single-aisle more than Airbus (the gap has closed in 800 units this year). The largest part of the difference comes in the single-aisles over 175 seats (A321, 737-9).
  • In terms of RPKs (“revenue passenger kilometer”), that is, the number of paying passenger by the distance they are transported, they see a similar future: Airbus forecasts for 2033 ~14.5 RPKs (in trillion) while Boeing forecasts 15.5 RPKs.

The main changes from last year’s forecasts are:

  • Both manufacturers have increased their passenger aircraft forecast, ~2,000 a/c Airbus and 1,000 a/c Boeing,.
  • Both manufacturers have increased the value of RPKs in 2033  (about 5-7%).
  • Both manufacturers have increased the volume (trn$) of the market in these 20 years, about 6.7% Airbus (to 4.4trn$) and 5.7% Boeing (to 4.86trn$) (excluding regionals and freighters).

Some lines to retain from this type of forecasts:

  • Passenger world traffic (RPK) will continue to grow about 4.7% per year (5.0% according to Boeing). This is, doubling every ~15 years.
  • Today there are about 16,855 passenger aircraft around the world (according to Airbus), this number will nearly double in the next 20 years to above 30,555 a/c in 2033 (over 33,000 as seen by Boeing).
  • Most deliveries to go to Asia Pacific, 39% or over 12,200 passenger aircraft
  • Domestic travel in China will be the largest traffic flow in 2033 with over 1,500bn RPK, or 11% of the World’s traffic.
  • Over 12,000 aircraft will be retired to be replaced by more eco-efficient type.
Trips per capita vs. GDP per capita (source: Airbus GMF).

Trips per capita vs. GDP per capita (source: Airbus GMF).

As I do every year, I strongly recommend both documents (GMF and CMO) which provide a wealth of information of market dynamics.

4 Comments

Filed under Aerospace & Defence

Is the average aircraft size decreasing or increasing by 25%?

Last year, I wrote a post (Aircraft average size: Boeing’s forecast in 1990 and following evolution) in which I compared what was Boeing’s prediction in 1990 of what was going to be the commercial aircraft average size evolution in the next 15 years versus the same prediction in 1997 and what had been the actual evolution through 2011, as reflected in Boeing’s 2012 Current Market Outlook (CMO).

See the graphics below:

Average aircraft size forecast made in 1990.

Average aircraft size evolution 1991-2011, according to Boeing 2012 CMO.

As I mentioned above, the information of actual evolution was provided by Boeing in 2012’s CMO.

This year (2013), Airbus seems to have responded by providing the same piece of information in its Global Market Forecast (GMF), see the picture below:

Average aircraft size evolution 1992-2012, according to Airbus.

Average aircraft size evolution 1992-2012, according to Airbus 2013 GMF.

The catch then is: is the average aircraft size decreasing (as Boeing says) or increasing by 25% (as Airbus says)?

The best part of the catch is that both cite the same source of information, OAG (Official Airline Guide).

The reader will obviously reach to the conclusion that both companies cannot be taking the same segmentation and that they are using the reported trend to convey an interested message.

After, having seen the number plays that Boeing has recently done in their CMO with the mix of wide-bodies widely changing from year to year in order to promote 787 or 777 (which explained in this post), I take the stand to take with grain of salt the graphic provided by Boeing, and thus, unless I see the numbers by myself, I will understand that average aircraft size has been growing since the 1990s (1).

(1) The funny thing of understanding that the correct interpretation is the one of Airbus (average size has grown by 25%) is that this would mean that Boeing’s own prediction in 1990 would have been proven correct! 🙂

Leave a comment

Filed under Aerospace & Defence

Airbus vs. Boeing, comparison of market forecasts (2013)

Last Tuesday, John Leahy, Airbus COO Customers, unveiled at a press conference in London the new figures of the 2013-32 Airbus’ Global Market Forecast (GMF, PDF 5.1MB).

The last two years, I already published comparisons of both Airbus’ and Boeing’s forecasts (Current Market Outlook, CMO, PDF 3.0MB). You can find below the update of such comparison with the latest released figures from both companies.

Comparison of Airbus GMF and Boeing CMO 2013-2032.

Comparison of Airbus GMF and Boeing CMO 2013-2032.

Some comments about the comparison:

  • Boeing sees demand for 14% more passenger aircraft (excluding regional a/c, same proportion as last year) with a 9% more value (excluding freighters).
  • Boeing continues to play down A380 niche potential (54% less a/c than Airbus’ GMF), though for third year in a row it has slightly increased its Very Large market forecast, again by 20 a/c, or 3.4%.
  • On the other hand, Boeing forecasts about 350 twin-aisle and 4,400 single-aisle more than Airbus, clearly pointing to its point-to-point strategy versus the connecting mega-cities rationale presented by Airbus.
  • In terms of RPKs (“revenue passenger kilometer”), that is, the number of paying passenger by the distance they are transported, they see a similar future: Airbus forecasts for 2032 ~14 RPKs (in trillion) (a ~9% increase vs last year GMF) while Boeing forecasts 14.7 (also increased about 7%).

The main changes from last year’s forecasts are:

  • Both manufacturers have increased their passenger aircraft forecast, ~1,000 a/c Airbus and 1,400 a/c Boeing, bigger increase than last year’s change (500 a/c both).
    • In the case of Airbus it has again mainly increased the single aisle segment (700 a/c), probably reflecting the success of the A320neo launch.
    • In the case of Boeing, they decreased the twin aisle segment (80 a/c), but increased the single aisle in over 1,400 a/c.
    • As I noted in a previous post, Boeing dramatically changed the twin-aisle mix, between small and intermediate. Now it has a mix closer to that of Airbus (60-70% of small twin-aisle).
  • Both manufacturers have increased the value of RPKs in 2032  (9% and 7%).
  • Both manufacturers have increased the volume (trn$) of the market in this 20 years, again 12% Airbus (to 4.1trn$) and 3% Boeing (to 4.5trn$) (excluding regionals and freighters).

Some catchy lines for those who have never seen these type of forecasts:

  • Passenger world traffic (RPK) will continue to grow about 4.7% per year (5.0% according to Boeing). This is, doubling every ~15 years.
  • Today there are about 16,100 passenger aircraft around the world (according to Airbus), this number will more than double in the next 20 years to above 33,600 a/c in 2032.
  • 2/3 of the population of the emerging countries will take a trip a year in 2032.
  • Domestic travel in China will be the largest traffic flow in 2032 with almost 1,400bn RPK, or 10% of the World’s traffic.
  • The A20 family: a take-off every 2.5 seconds, with 99.6% reliability.
Trips per capita vs. GDP per capita (source: Airbus GMF).

Trips per capita vs. GDP per capita (source: Airbus GMF).

As I do every year, I strongly recommend both documents (GMF and CMO) which provide a wealth of information of market dynamics. In case you find it tough, to read those kind of booklets, you may take a look at the video of the press conference, a great class on global economy, world aviation, forecasting, trend spotting (1h08’28”):

10 Comments

Filed under Aerospace & Defence

Twin-aisle aircraft deliveries 20-year forecast

I read in the following article “Airbus seeks to increase Washington State supply business; aims for 13 A350s/mo” (from Leeham News) how from a presentation of a A350 supplier (ElectroImpact) at an aerospace suppliers event in Washington State, it was concluded that the Airbus aimed at building 13 A350s per month, as the mentioned supplier had built its factory with capacity to extend production rates up to those 13 aircraft.

This would be news because in its presentations Airbus talks about a production ramp-up up to 10 a/c per month (as does Boeing for the 787, which 10 aircraft/month should be reached by the end of 2013).

Having analyzed several times Airbus’ Global Market Forecast (GMF) and Boeing’s Current Market Outlook (CMO), I believe that those production rates of above 10 aircraft per month should be expected by industry followers just by seeing the numbers included in those forecasts.

In 2012, the GMF forecasted about 6,500 twin-aisle to be delivered in the next 20 years. The CMO indicated 7,210 aircraft. In 2013, Boeing CMO slightly reduced the figure to 7,130 a/c.

Comparison of Airbus GMF and Boeing CMO 2012-2031.

Thus, both companies expect between 6,500 to 7,200 twin-aisle passenger aircraft to be delivered in the following 20 years (excluding freighters, 747 and A380 – these 2 considered as Very Large Aircraft in the studies).

1st approach. If we were to take the mid-point of both forecasts, about 6,850 a/c, and simply divided by 20 years, we would reach to an average figure of 343 twin-aisle aircraft to be delivered per year between the 2 manufacturers, or 28 a/c per month. If Airbus wanted to maintain the long-term 50% market share, it would have to aim at delivering 14 a/c per month between all its twin-aisle products, which soon will be A330 and A350.

2nd approach. However, current twin-aisle production levels are in no way close to those 343 a/c per year. In 2012 there were 258 deliveries thanks to the introduction of 787s, but in the previous decade the average was about ~165 a/c per year. Thus, manufacturers must have a deliveries’ ramp up to accommodate those 6,850 in the next 20 years. Not knowing what that ramp-up is, I just linearized from where we are today and what is to be delivered.

I plotted in the graphic below all the deliveries of twin-aisle (excluding Very Large Aircraft) from the 1970s to 2012, and then what a forecast could be departing from 2012 deliveries’ figure to accommodate ~6,850 a/c in the next 20 years.

Taking a look at the graphic, one can already understand that if we take the GMF and CMO forecasts as good ones, the manufacturing rhythm will have to accelerate in the following years, especially in the second decade. In the late 2020s, over 400 twin-aisle would have to be delivered per year (over 33 per month), thus manufacturers will have to churn above 16 a/c per month each, that is the double of what they produced during the last decade.

Twin-aisle deliveries: historic series (1970s-2012) and forecast (excludes VLA -A380  & 747).

Twin-aisle deliveries: historic series (1970s-2012) and forecast (excludes VLA -A380 & 747).

Market shares. One could wonder whether this growth will favour more one company or the other. I compared market shares (excluding VLA):

  • in 2012: Boeing delivered 155 twin-aisle (26 767s, 83 777s, 46 787s) vs. Airbus 103 a/c (101 A330s, 2 A340s)… 60% / 40%.
  • in 2003-2012: Boeing delivered 839 twin aisle (148 767s, 642 777s, 49 787s) vs. Airbus 880 a/c (44 A300s, 687 A330s, 149 A340s)… 48% / 51%.
  • in 1993-2012: Boeing delivered 1,687 twin aisle (572 767s, 1,066 777s, 49 787s) vs. Airbus 1,521 a/c (175 A300s, 31 A310s, 938 A330s, 377 A340s)… 50% / 45%.

[The shares in the past decades include marginal deliveries from Ilyushin models and McDonnell Douglas models, which share I kept out of Boeing even after the merger in august 1997, these are ~30 a/c to be added to the 1,687]

Seeing that market shares have been fluctuating but always around 40-60% for each company, they could expect to have to at least deliver 40% of those 6,850 a/c in 20 years, or of those above 400 a/c in the late 2020s.

Backlog. Finally, just to see how the twin-aisle mix for each company is going to be, let’s look at the aircraft on order (backlog) that each company has as of today (end June 2013):

  • Airbus (43%):
    • A330: 260 a/c to be delivered.
    • A350: 678 a/c to be delivered.
  • Boeing (57%):
    • 767: 56 a/c to be delivered.
    • 777: 339 a/c to be delivered.
    • 787: 864 a/c to be delivered.

Thus, of the 6,850 twin-aisle to be delivered in the next 20 years, about 2,200 are already contracted as of today (plus the above 130 a/c delivered within the first half of 2013), thus 33% of those 6,850 a/c is more or less secured and among those the split is 57 / 43 for Boeing.

2 Comments

Filed under Aerospace & Defence

Aircraft market forecasts accuracy

In a previous post I wrote about how the predicted average aircraft size by Boeing in 1990 did not match the actual evolution of that average size since then. In a more general context, how accurate are these aircraft market forecasts? Especially taking into account that they forecast along a 20-year period.

I dug in the archives and found an article in Flight International‘s issue of 10-16 March 1993 which compared Airbus’ GMF and Boeing’s CMO (you can find 2012 comparison here). Some excerpts from that article:

  • “Boeing is projecting deliveries of 12,005 aircraft, worth $815 billion at current values, from 1993 to 2010.”
  • (Boeing) “The trend towards larger aircraft will accelerate so that, although single-aisle types will account for about two-thirds of all deliveries, they will comprise 74% of those up to 2000 and only 60% beyond.”
  • “Airbus Industrie has released an upbeat forecast, predicting market demand for 11,653 new jet airliners to be delivered during 1992-2011, up from the 11,500 deliveries predicted in 1991.”
  • (Airbus) “The manufacturer foresees an accelerating demand for widebodied aircraft, driving average airliner size from today’s 176 seats to 255 seats in 20 years.”
  • (Airbus) “The global jet-airliner fleet will grow to 10,000 by 1998 and to almost 15,000 by 2011.

Now, let’s see what was the fleet at the end of 2011. Seeing Airbus’ Global Market Forecast from 2012, the departing numbers are those of 2011 fleet.

  • Passenger aircraft: 15,556 a/c.
  • Freighter aircraft: 1,615 a/c.

Thus, 17,171 a/c at the end 0f 2011. The GMF from 1992 underestimated the 20-year market by slightly above 2,100 or nearly 15% error. Not a bad shot taking into account the time span used.

Let’s take a more recent example, this time from Boeing. In the CMO from 1997, we find the following chart showing Boeing’s forecasted fleet size and distribution for 2001, 2006, 2011 and 2016 year-ends.

1997 Boeing CMO year-end fleet forecasts for 2001, 2006, 2011 & 2016.

In 2012 CMO, Boeing offered figures of 2011 year-end fleet.

Fleet at year end 2011 according to Boeing 2012 CMO.

We can make a quick comparison:

Comparison of aircraft fleet at year-end 2011: 1997 forecast vs. actual (sources: Boeing CMO 1997 and 2012).

Some reflections:

  • The total fleet figure was missed only by 1%.
  • The single-aisle figure was missed only by 2%, though less larger single-aisle were acquired than expected.
  • Where the forecast is off mark is in both regional jets (underestimated) and twin-aisle, where there are almost 1,800 less aircraft in the current fleet than forecasted… another reason for Boeing to play down on A380 segment.

***

NOTE: Figures of current fleet from Boeing and Airbus differ. Some causes: Airbus does not include figures for regional jets, and definitions between large aircraft and twin-aisle vary from one company to the other. Other than that, figures for freighters are similar, 1,615 (A) vs. 1,740 (B), as they are for passenger single-aisles, 12,161 (A) vs 12,030 (B).

3 Comments

Filed under Aerospace & Defence

Airbus vs. Boeing, comparison of market forecasts (2012)

Yesterday, John Leahy, Airbus COO Customers, unveiled at a press conference in London the new figures of the 2012-31 Airbus’ Global Market Forecast (GMF, PDF 5.6MB).

The last two years, I already published comparisons of both Airbus’ and Boeing’s forecasts (Current Market Outlook, CMO, PDF 3.0MB). You can find below the update of such comparison with the latest released figures from both companies.

Comparison of Airbus GMF and Boeing CMO 2012-2031.

Some comments about the comparison:

  • Boeing sees demand for 14% more passenger aircraft (excluding regional a/c) with a 19% more value (including freighters).
  • Boeing continues to play down A380 niche potential (56% less a/c than Airbus’ GMF), though for second year in a row it has slightly increased its Very Large market forecast, this time by 20 a/c, or 3.5%.
  • On the other hand, Boeing forecasts about 200 twin-aisle and 4,200 single-aisle more than Airbus, clearly pointing to its point-to-point strategy versus the connecting mega-cities rationale presented by Airbus.
  • In terms of RPKs (“revenue passenger kilometer”), that is, the number of paying passenger by the distance they are transported, they see a similar future: Airbus forecasts for 2031 ~12.8 RPKs (in trillion) (a ~4% increase vs last year GMF) while Boeing forecasts 13.8 (also increased about 3%).

The main changes from last year’s forecasts are:

  • Both manufacturers have increased their passenger aircraft forecast in about 500 a/c, less dramatically than last year’s change.
    • In the case of Airbus it has increased the single aisle segment, probably reflecting the success of the A320neo launch.
    • In the case of Boeing, they decreased both single aisle (130 a/c) and small twin aisle (300 a/c), but increased the intermediate twin-aisle in 900 a/c… selling internally a new version of the 777?
  • Both manufacturers have increased the value of RPKs in 2031.
  • Both manufacturers have increased the volume (trn$) of the market in this 20 years, 12% Airbus (to 3.7trn$) and 10% Boeing (to 4.4trn$).

Some catchy lines for those who have never seen these type of forecasts:

  • Passenger world traffic (RPK) will continue to grow about 4.7% per year (5.0% according to Boeing). This is, doubling every ~15-20 years.
  • Today there are about 15,500 passenger aircraft around the world, this number will more than double in the next 20 years to above 32,500 a/c in 2031.
  • The A380 market equation: Urbanisation + Mega-cities + Wealth = VLAs (Very Large Aircraft, i.e. A380 and B747).
  • Emissions of aviation industry amount to 2% of man-made CO2 emissions.
  • Centre of gravity of world travel will have moved from the Atlantic Ocean (in 1971) to the Middle East (2031).
  • A key driver here is the propensity to fly of the people as the economies of their countries grow. This is captured well by the graphic below, a classic in the industry. This time, Airbus mentioned in the GMF that it has carried out a survey during summer asking 10,000 people around the world whether they expected to fly more in the future. This was true especially in China and India.

Trips per capita vs. GDP per capita (source: Airbus GMF).

Again, I strongly recommend both documents (GMF and CMO) which, differences apart, provide a wealth of information of market dynamics. The complete book from Airbus will be published online next week according to Chris Emerson (SVP for Future Programmes & Market Strategy).

In case you find it tough, to read those kind of booklets, you may take a look at the video of the press conference, a great class on global economy, world aviation, forecasting, trend spotting…

11 Comments

Filed under Aerospace & Defence